Explore a CAD-based land use map of Delhi with grid overlays. Learn how to analyze satellite data, convert GIS to AutoCAD, and create a city-scale map for planning or thesis work.
🌆 1. What This Drawing Shows
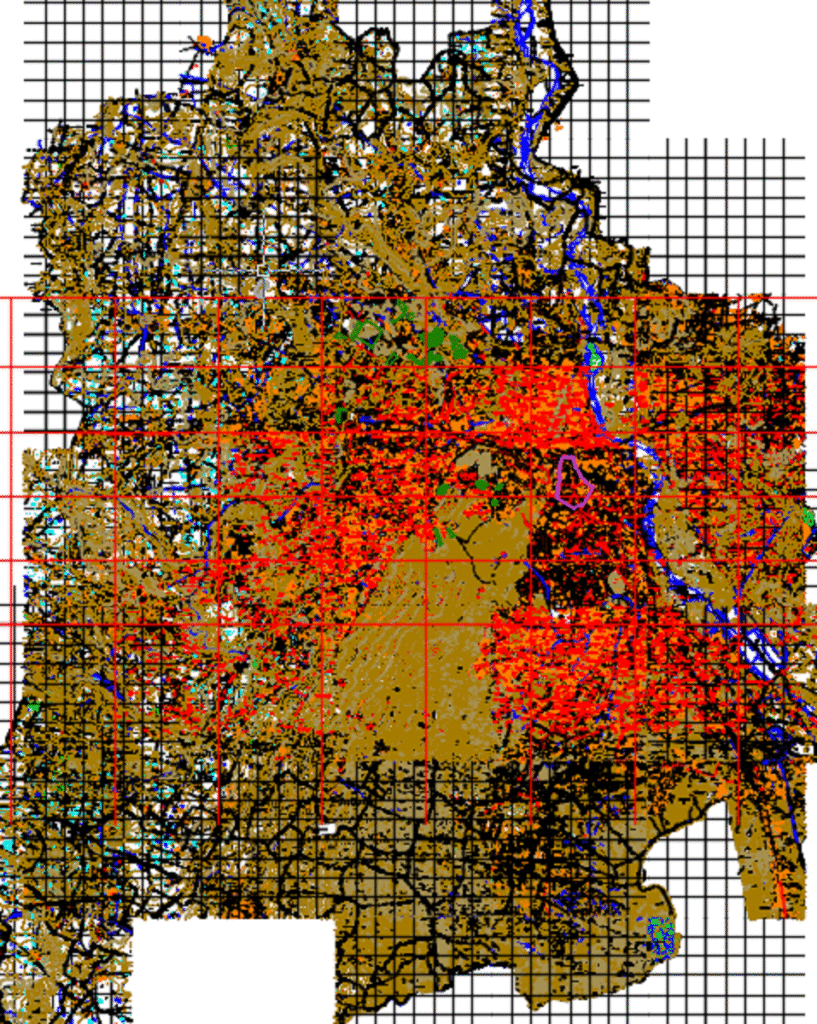
This map is a macro-level planning tool for Delhi, showing:
- 🔴 Urban density zones (likely in red)
- 🌳 Natural terrain and vegetation
- 🌊 Water bodies and the Yamuna River
- 🧮 Grid overlays for indexing or zone coding
- 🗺️ Topographic accuracy, ideal for large-scale planning
Such a drawing is useful in:
- Master planning
- Environmental impact assessments
- Infrastructure layout
- GIS-to-CAD transformation practice
🎓 2. Who Should Use This?
✅ Urban Planners & Landscape Architects
✅ GIS Mapping Students
✅ M.Plan / Thesis Researchers
✅ NGOs or Policy Analysts working with spatial data
🛠️ 3. How to Recreate This in AutoCAD
✅ Step A: Import Base Map
- Convert shapefile to DWG using QGIS → DXF Export
- Clean up linework in AutoCAD
- Adjust UNITS and SCALE
✅ Step B: Apply Layers
| Layer Name | Color | Use For |
| Urban_BuiltUp | Red | Dense construction areas |
| GreenCover | Green | Forests, parks, agri land |
| Water | Blue | Rivers, canals |
| Roads | White | Major transport corridors |
| GridOverlay | Black | Coordinate divisions |
✅ Step C: Use Hatches & Colors
- Use HATCH or SOLID to distinguish zones
- Apply TRANSPARENCY for overlays (AutoCAD 2019+)
- Use BLOCKS for symbols like wells, towers, trees
✅ Step D: Add Grid References
- Use ARRAY or DIVIDE to place grids
- Label with MTEXT (e.g., A1, A2, B1…)
- Use consistent spacing (e.g., 5km x 5km)
🔍 4. What You Learn From This Drawing
- 🌐 City-Scale Mapping
- 🧭 Topographic Layering
- 📊 Visualizing Urban Sprawl
- 🛰️ Integrating GIS with CAD
- 🧱 Prepping Base Maps for Site Planning
📥 5. Download Link

🔗 [Click here to download the Delhi Land Use DWG]
🔗 6. Related DWGs
- [Satellite-Based Land Cover DWG of Pune]
- [Topographic Map with River Systems in AutoCAD]
- [Regional Master Plan DWG Template for Indian Cities]